Click here for full display of Indigenous Voice referendum results.
Sunday morning
Below is the output of a linear regression model that uses four demographic variables (together with controls for state-level effects) to explain 87% of the variation in the yes vote by electorate, limited for technical reasons to the 141 seats of the five mainland seats.
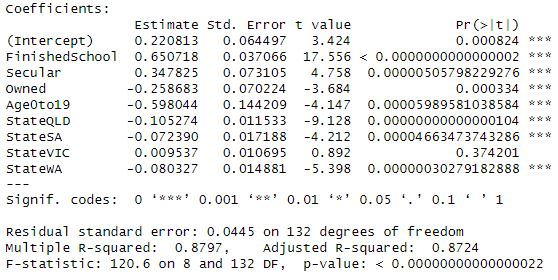
The choice of the four demographic variables was constrained by the need to pick ones that didn’t correlate over-much with each other. This tends to mean they could have been replaced with other variables they correlated with and still produced a robust result. To go through the four in turn:
Finished School, i.e. completed year 12. As you would expect, yes did very considerably better in seats with high educational attainment and occupational categories related with it. Such seats also tend to have high numbers of people in their twenties and thirties and renters, and few labourers.
Secular. Seats with a lot of people who identified as having no religious affiliation were significantly stronger for yes. This is a favourite variable of mine, because it reliably associates with support for post-materialist causes including a republic, same-sex marriage and the Indigenous Voice, and also with voting for Greens and teals.
Owned. Yes did worse in seats where a lot of people owned their homes, which in turn correlates strongly with the 60-plus age cohort, a measure of which might well have taken its place in the model.
Age0to19. Seats with a lot of children — or, looked at another way, mortgage-paying families — tended to do poorly for yes.
The four “state” variables tell us only that yes did better in the two bigger states than the three smaller ones, which we can tell more efficiently by looking at the results. In particular, they tell us that it did so over and above what might be expected from demographic variation between the states on the variables described above.
Saturday night
1.45am. Results updating again now, presumably with little if anything further to be added for the evening.
12.50am. There are still a few results outstanding in WA, but I’m going to have to turn off my results updating for a couple of hours. If you’ve found it in any way entertaining or useful — and it’s still the only place where you can find the results at booth level — please consider helping out with a contribution through the “become a supporter” button at the top of the site.
11.55pm. Most of the Mobile Remote Team results are in from Lingiari now, and the yes vote among them has come back to 71.6%.
10.39pm. My live results stalled for a bit there because I was hacking around trying to get Remote Mobile Team results to appear in Lingiari, which they are now doing. These are of interest because they serve largely, though not exclusively, remote Indigenous communities. With six out of 22 reporting, the results are 2908 yes (79.7%) and 742 no (20.3%).
9.34pm. Looking increasingly certain now that Victoria will also be a no. Early numbers in Western Australia confirm what you would expect there too.
8.35pm. The prospect of a yes majority in Victoria has been drifting away, with my projection of 51.7% no getting steadily closer to the raw result of 52.2%. These numbers are probably flattering yes, because postal votes in particularly are likely to be very conservative.
8.07pm. First numbers from Northern Territory are about 70-30 to no, but this could be a bit of a rollercoaster due to the peculiarity of heavily indigenous remote mobile booths — no insight I can offer on when those might report.
7.58pm. Malarndirri McCarthy on the ABC going through results from heavily indigenous booths in Queensland, which are as high as 75%. You can see the relevant booths on my pages for Leichhardt and Herbert — click activate at the bottom of the links to see the map display, and the ones with green (i.e. yes) numbers are pretty much the ones McCarthy was going through.
7.55pm. If the potential for voting to happen after the result is confirmed be deemed an issue, WA is getting a bad case of it, thanks to daylight saving and decisive results on the eastern seaboard.
7.53pm. My system has come through with the formality of calling Queensland for no, joining New South Wales, South Australia, Tasmania and the national result. The ACT is called for yes, and I have a 68% probability for no in Victoria. Nothing yet from the Northern Territory, where polls closed 23 minutes ago, or Western Australia where they do not close for over an hour.
7.31pm. My system has also been calling the national vote for no for some time, and clearly won’t be long in calling Queensland for no. Victoria remains very close, with yes having consistently been projected to be a shade below 50%.
7.24pm. Got that out a matter of seconds before Antony Green said the same.
7.23pm. My system is calling South Australia for no.
7.18pm. First results emerging from Queensland, inevitably going very heavily to no from small rural booths.
7.17pm. Behind Antony Green’s eight-ball here, but my system is now calling NSW for no.
7.07pm. I’m projecting a tight result in Victoria — raw yes vote is 47.5%, but my adjustment to account for where the votes are from gets it to 49.2%.
7.03pm. ABC calling New South Wales for no, though my system isn’t quite there yet.
6.59pm. And for what very little it’s worth, my system is calling the ACT for yes.
6.57pm. My system is calling Tasmania for no, and so apparently is Antony Green’s.
6.52pm. Among many other dubious things, the no campaign succeeded in propagating several news reports to the effect that teal seats were going to do badly for yes. But so far, yes ranges from 58% in Mackellar to 73% in Kooyong.
6.48pm. I’m calculating probabilities in a way I’m not confident enough about to include in the results pages, but they’re getting very close to calling Tasmania for no and ACT for yes — although Tasmania could potentially swing back as more Hobart booths report.
6.45pm. First booth in from South Australia — Darke Peake in Grey — records 55 votes for no and three for yes.
6.40pm. If you’re finding the results feature of any use or interest, you may perhaps care to make a contribution through the “become a supporter” buttons you’ll find at the top of this page or on the results page itself.
6.38pm. My projection for yes has improved in Victoria, from around 43% to 46.6%. But thumping no leads elsewhere.
6.27pm. So far I’m projecting very similar results in New South Wales, Victoria and Tasmania — the three states where voting has closed — ranging from 56.6% to 57.7%. Yes well ahead from a tiny count in the ACT.
6.21pm. With only yes and no to count, rather than multiple candidates never mind two-candidate preferred, the count is clearly going to progress very quickly. So far, there are seven booths with yes majorities and 44 with no.
6.20pm. The very earliest results are presumably from the most rural of areas, whereas my projection works off seat results. So if the booth results so far are conservative even by the standards of the seats they are in, as I suspect to be the case, the early projections should be unflattering for yes.
6.15pm. Small booths in from Farrer and Parkes in NSW and Wannon in Victoria, and my results seem to be working.
6pm. Polls have closed in eastern states with daylight saving. My results feature consists of a front page summarising results at national, state/territory and seat level, and results pages at House of Representatives seat level which include booth results in both table and map form (for the latter, click the activate button at the bottom of the relevant page). The seat results pages can be accessed from the drop-down menu or the “results by electorate” section at the bottom end of the main page.
The “projected” results for the national and state/territory votes make use of the seat-level estimates from Focaldata’s multi-level regression with post-stratification exercise as a baseline for measuring such results as are reported. However much they differ from Focaldata’s estimates of the relevant seats is projected on to Focaldata’s aggregated estimates. Doubtless this will be noisier than the booth-matched swings methods that can be applied at elections, but it should at least go some way towards correcting for the peculiarities of the early numbers.
Call of the board for Yes, with current results:
NSW 10: Bradfield, Cunningham, Grayndler, Kingsford Smith, Mackellar, Newcastle, North Sydney, Sydney, Warringah, Wentworth.
5 ALP, 4 teal ind, 1 Lib.
—–
Vic 12: Chisholm, Cooper, Fraser, Goldstein, Higgins, Isaacs, Jagajaga, Kooyong, Macnamara, Maribyrnong, Melbourne, Wills.
9 ALP, 2 teal, 1 Grn.
—–
Qld 3: Brisbane, Griffith, Ryan. 3 Green.
WA 2: Curtin, Perth. 1 teal, 1 ALP.
Tas 2: Clark, Franklin. 1 ind (Wilkie), 1 ALP.
ACT 3: all ALP.
___________
32 seats all up. 19 ALP (out of 77), 7 teal (all), 4 Green (all), 1 Lib, 1 Andrew Wilkie.
Mostly it’s what you’d expect – all the teal and Green seats, plus inner-suburban Labor seats (in Sydney, Melbourne, Perth, Hobart and Canberra, although not Adelaide or Brisbane). Melbourne has a few extra middle-suburban seats like Jagajaga and Isaacs. The two that stick out are Newcastle and Cunningham. Last year the Greens cracked 20% in both seats and weren’t far off the Libs. And of course there’s Bradfield, where Julian Leeser came close to losing to another teal.
I’m also gonna guess that if you list all 151 seats by Aboriginal population, from Lingiari downwards, most of these 32 come in close to the bottom.
Thankyou so much as always for your work Monsieur Bowe.
hazza,
How to completely miss the point. Typical
Leftie arrogance.
FUBAR I think the research bears that out.. kids just need that *one stable influence that encourages them* and helps keep them on track. *Ideally* their two parents in an intact family. Second to that, ideally a figure within their own family or community.. but regardless, having that stable influence committed to encouraging them in the right way, providing some stability, is just so categorically linked to future success.
If successful Aboriginals could be that person for as many Aboriginals as they could, that would be fantastic, and I would assume many would be minded to do this.. it will pay dividends over time.
Kids need to be told the right things, (over and over again) it is so essential.
Work hard, and be persistent, and don’t give into despair, and act responsibly and politely, and no matter what, (excepting sheer chance and unfortunate accidents), you *WILL* get somewhere.
And no matter what, and for whatever reason, you depart from that, you certainly will put that at risk.. So you may do so.. but then must accept your own agency in that decision.. and thus the consequences you may face.
Is that the dialogue a lot of Aboriginal kids receive? Do they receive that from leftists as a whole?
Been There,
You, clearly, do not get it.
Peggy “Welcome to pollbludger, the ABC and the Age. Two blokes face off in a democratic poll. One bloke gets 40%, the other gets 60%. The bloke that got 60% is the one with the problem.”
Heh. The left don’t want to listen, they want to tell.
And by doing so they do a great job of generating resistance to themselves.
Whenever I came into a management position over other workers, and commenced with listening, before I began telling, I always found it much easier to move the team in a way that satisfied the most people, and made reaching my own goals much easier.
But I guess, since they aren’t listening, that secret to success will continue to elude them.
A good night in the Antipodes – both Australian and New Zealand voters gave the the tin-eared arrogant elitist lefties a good whack.
SMCOPerth
Everything you write makes a lot of sense. Do not expect any of it to be acknowledged or accepted by the vast majority of posters here. Their absolute moral certitude in their own infallibility- despite the evidence- is a sight to behold.
Amusing that some comments on here are accusing commenters on this blog of being “full of lefties”. Because the comments are skewing more towards yes. Despite there being a link above that shows a seat-by-seat breakdown that clearly didn’t follow party lines
I would imagine that people commenting on a psephological blog are a particular kind of person. Not saying there isn’t a diverse range of political views, there surely are. But I would imagine the commenters here skew very heavily in the politically engaged direction. And given the result in the ACT I would guess that the heavily politically engaged skew towards Yes. So it shouldn’t surprise that the comments under this blog do also
The left invested in 60 years of wall to wall propaganda saying that people should not be divided or treated differently based on their race..
..and then in a couple of short years wanted to undo that programming and say that, actually it is okay to do that, so long as you discriminate positively for this group, and not that group.
Sorry guys, it will take a number of decades to undo the programming you first installed. And in doing so beware you don’t at the same time undo the intent behind the original programming effort as well: that is, for Whites not to feel entitled to act in their own interests. When you (as you have been for a few years now) begin telling people it is legitimate for X, Y, and Z to act in their own racial interests, but not W.. you may see your initially successful reprogramming of W, begin to lose hold.
Note how critically trust has been lost in societal institutions (universities, media, teachers etc) as such efforts have begun to be made. You may find the second programming effort much more difficult, when the vectors and agents to promote it, have themselves lost so much credibility and trust.
oh, we’re talking about “programming” now. Goodie
SMCOPerth, next time just type “Aboriginals need to pull themselves up by their bootstraps” and save yourself paragraphs of garbage.
Bradfield in Sydney North Shore is the only Liberal seat that has voted yes. I spy with my little eye a 2025 Teal pickup 🙂
“Positive discrimination” is an effort to reverse existing discrimination, not to introduce it where it doesn’t already exist. This is pretty basic.
It’s a difficult concept only for people who believe (or want to pretend) that everyone would be receiving equal treatment without it.
If you break one leg do you expect the doctor to treat both legs the same?
While the result is disappointing, it does seem to indicate that Teal seats are unlikely to be the strategy for Dutton to win the next federal election. The next election is going to be fought on the rust belt seats like Hunter, Paterson, Robertson and Werriwa. It will be a classic polarised battle between Trumpists and anti-Trumpists where the middle ground is in the outer suburbs.
Fubar….arrogant lefties????
Look at you gloating over the defeat of something that could have really, seriously helped!
Fuck off you and all of your types!
Sorry people and William but I have had enough of this shit.
I’m buzzing off!!
Scattershot look at several different seats, either yes or no, any state…
Prepoll votes seem a lot worse for Yes than booths on the day. (Random example: Kingston, 40.3% on polling booths but 29.3% on prepolls.)
Fremantle: 52.2% for booths, 40.8% for prepolls.
etc etc. I’m not doing this properly at this time of night, but it seems to be a pattern.
Also in / around Freo: 76.6% at Fremantle South (that’s what the AEC calls it, it’s not South Freo), but 49.2% in Spearwood. Then, 41.2% at Spearwood South. This is a 20 min bus trip down Rockingham Rd, that some people in Freo have clearly never done. I might have to go to Freo tomorrow after work, just to harass people I know down there who never get out of their echo-chamber bubble.
I can’t believe SA is at 64.4 No. I thought the Labor premier had some pull there.
Not a single SA seat voted yes.
Melbourne is the greenest seat in the nation at 78% yes.
Nice of the non racists to turn up and tell us the only reason they hold racist views is because the nasty lefties call them racists and if you stopped calling them racists they might act differently. You know it makes sense.
What they really want is the freedom to hold racist views without anyone pricking their conscience.
Coal country in QLD is greatest No.
The highest Number is Flynn at 83.6%.
MelbourneMammoth @ #564 Sunday, October 15th, 2023 – 2:07 am
I would put Dobell, rather than Robertson in that category.
While there is a new open thread, I would like this one to keep rolling with discussion focused on the progress of the count and analysis of the results, with the yelling matches reserved for the other place.
meher baba @ 8.18pm
Spot on.
The ancestry of both Jewish & Palestinian peoples is the same.
They are both Semite.
The reference to opposition to Jewish as being “antisemitic” is a 20th century construction, associated with the fascist regimes which rose to power across Europe.
It is interesting to note that many of the electorates which did support “The Voice” comprise large Jewish communities.
Sorry missed Maranoa. It had the highest No at 84.1%.
I’d noticed the stronger no vote in prepolls too, and think it reflects a combination of two things: a late swing to yes (as picked up in some polls), and a much stronger yes than no presence at booths – no surprise in Cooper where I was, but I saw plenty of reports of the same from elsewhere in the country too.
The chief advocate for Yes was the ABC.
Both in their news coverage and their so called current affairs programs.
I will watch insiders with interest today. No doubt the result was all the doing of the big spending, nasty, and overwhelming support for No by all media outlets .
Barton – held by Burney – only 45% Yes. Basically says it all.
Lingiarir – held by Scymgour – 42% Yes. What a disaster.
seadog
You really want to keep pushing that failed rhetoric?
Bird of Paradise @ 1.32am
Thanks for this electorate breakdown of Yes supporting seats.
This result I don’t consider to be surprising.
Despite what some Poll Bludgers are suggesting that this result is fatal to the electoral fortune of the current government – I completely disagree with that statement.
Recent polling has demonstrated a huge difference between support for the now defeated Referendum and the electoral support for both the Government and the Opposition.
The 2PP still has the Government with a 6-8% margin over the Opposition.
The Government has done what it had said it would do in relation to the Uluru Statement from the Heart.
The electorate has spoken and now the Government can focus upon the issues which concern the majority of that electorate.
And yes, my family and the majority of my old, baby boomer friends voted; YES!
Bird of paradox
thanks
My view at the start was No would win, and Peter Dutton had signed a political suicide note. Still my view, the result, polls and your analysis of the seats support that view.
All that is now left is putting up with several weeks of the Liberals and the media hacks tying to convince us Mr No is something else.
FUBAR
The poll results at the start of the thread indicates your dream has turned to mush. Mr No has cemented his reputation and that is about it. The Liberal now need to worry, is the slight further swing to Labor a blip or the start of a trend. Dutton has made a giant political miss-calculation. I don’t expect you or Dutton to work out why.
I think Malinauskas would be pretty worried about his state Voice, which is pretty similar. I can’t believe even Adelaide didn’t vote Yes.
I can see lots of points being scored against him given the size of the defeat.
The raciest trope serves no purpose.
We all should be equal under the law is a valid position.
My view was it was not a relevant referendum argument, but that point of view is not clear cut.
Diogenes says:
Sunday, October 15, 2023 at 8:24 am
I think Malinauskas would be pretty worried about his state Voice, which is pretty similar. I can’t believe even Adelaide didn’t vote Yes.
I can see lots of points being scored against him given the size of the defeat.
Ya and the same goes for Victoria.
https://www.theguardian.com/australia-news/2023/aug/09/rift-emerges-over-voice-to-parliament-in-victorias-newly-elected-first-peoples-assembly
I also wonder what contribution “welcome to country” made to the outcome. It really is a bit of a wank. The communities have long gone, I wonder if pretending otherwise was helpful.
The Adelaide result is an interesting and disappointing one. Supposedly SA was a ‘swing state’ (not sure where that polling came from but at some stage they must have picked up on something I guess). When speaking with friends interstate it did feel like it had an even higher degree of targeting from the no campaign here who were pretty relentless and intense. I was constantly bombarded with cr@p in my letterbox, let alone the digital marketing and campaign events.
Mind you, there are plenty of racist bogans here so it might just be that.
I have to point out that everyone is “racist”. It’s deeply ingrained in our DNA. Babies are racist. We react differently to groups that are not “people like us”. It’s worth remembering before pouring out the vitriol. Obviously not everyone acts on it though.
I bet a vote on having a Welcome to Country at the start of every public service meeting would have met the same fate. Pointless tokenism at its worst.
A random question. Did Christmas Island and the Cocos (Keeling) Islands participate in the Referendum?
I thought they were counted as part of Lingari (NT) but I can’t see where.
Norfolk Island did and is counted as part of Bean (ACT).
frednk
At no point have I linked the outcome of this referendum to the political polling performance of any party. Not once. So, you jam your post where the sun doesn’t shine.
The ABC and other similarly politically aligned are headlining this as a rejection of recognition. Recognition was just the fig leaf. The wedge. What was rejected was the race based body that was going to be given privileged access to both Parliament and more importantly all of the executive government – having been asked to vote on the vibe of the matter.
Never in my life have I been so disappointed in this country.
That sounds like a load of shit.
Babies are racist.
I am going to put that on a T-shirt.
Will there be anymore counting today? Does anyone know?
Ok, the answer is yes. The aec is showing updates at the individual seat level started at 8;00am this morning.
Most of the updates seem to be the count from Special hospital voting booths
Your call of the board goes to show Anglo Aussies in the cities are least racist, whilest the coloured/multicultural electorates and also rural electorates are most racist towards our indigenous brothers and sisters
Babies prefer and spend more time looking at faces that are of the same skin colour that they see the most.
Cameron
Hillary woukd say “bitter and resentful”.
“Below is the output of a linear regression model that uses four demographic variables (together with controls for state-level effects) to explain 87% of the variation in the yes vote by electorate”
Ta, William.
87% in a real live regression is powerful. Did you check LOTE as a variable?